Analysing pytest results using ActiveData
When attending Selenium Conference 2016 in London, I was particularly interested in any talks on how others are analysing their test results. There have been many times I would like to things such as how many tests we’re running, what percentage of them are failing, and which tests take the longest to run. Rather than implement something from scratch, I was hoping that I could take inspiration from others. I wasn’t disappointed, as both Dave Cadwallader and Hugh McCamphill gave presentations on how they gather and analyse their test results.
Unfortunately, neither of these fitted neatly into our Python test suites. It did however confirm that gathering this data in a way that can be queried and visualised was worth pursuing, and provided the much needed inspiration.
At Mozilla, many of our test results, builds and performance data are already collected by ActiveData, allowing the data to be publicly available and directly queried. This made it the perfect destination for the Selenium test suites that I wanted to discover more about. The difference between the test results already in ActiveData and the Selenium test results I wanted to introduce was the format of the data. The existing tests are using a Python package named mozlog to generate a raw structured log, which could then be normalised and ingested by ActiveData.
Rather than modify ActiveData to understand an alternative (and more limited) data format such as xUnit or TAP, it made sense to add a simple plugin to mozlog so that tests using pytest could easily create structured logs via the command line. One unfortunate side-effect of this is that mozlog only currently supports legacy Python, so it’s not possible to use Python 3 if you want to generate these logs.
Once we started to create these structured logs, it quickly became clear that the data lacked context. We had the test names, but nothing to indicate the suite or the application under test. This provided the perfect opportunity to create a plugin I’ve been thinking about for some time, so I wrote and released pytest-metadata. This plugin gathers various data about your test session, including the platform, version of Python, pytest, associated packages, and plugins. It also detects when tests are being run in a variety of continuous integration servers and pulls in relevant details. I had written something similar within pytest-html for displaying the environment details in the report, but had been meaning to split it into a separate plugin.
With the enriched structured logs now being generated in our continuous integration, all I needed to do was to publish them to Amazon S3 and hand over the ActiveData work to Kyle Lahnakoski. In no time at all, Kyle had the data being ingested and available to query. For now we plan to run queries and plot data as needed, however we’re also planning to connect our Redash to ActiveData to make it easier for anyone to visualise this data.
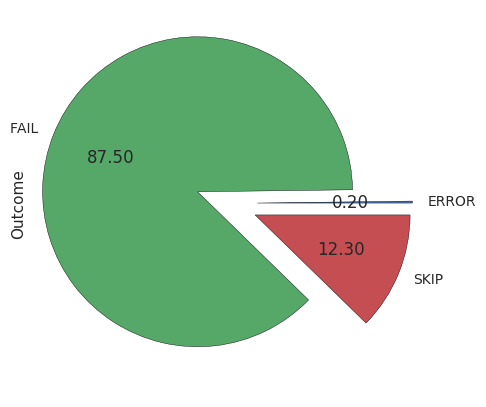
Here’s an example of the test outcomes (excluding passing tests) for the last two weeks:
If you’re interested in setting something like this up for your tests, then you may find that ActiveData is overkill. It’s not particularly difficult to set it up, but the ActiveData-ETL pipeline involves normalising the results, and scanning the Amazon S3 bucket. These are code pointers, but they belong to a bigger network of machines, and code, that uses it. To get this code to work on a single machine will require some coding.
If you’d like to read more about how this works, or you want to run some queries on our test results you can read the documentation. Let me know what you discover!